

Australians and COVID-19
COVID-19 is continuing to affect the health and wellbeing of Australians. Since the start of the pandemic Australia has reported*:
- 8,511,844 total cases
- 74,747,685 total tests
- 10,326 total deaths.
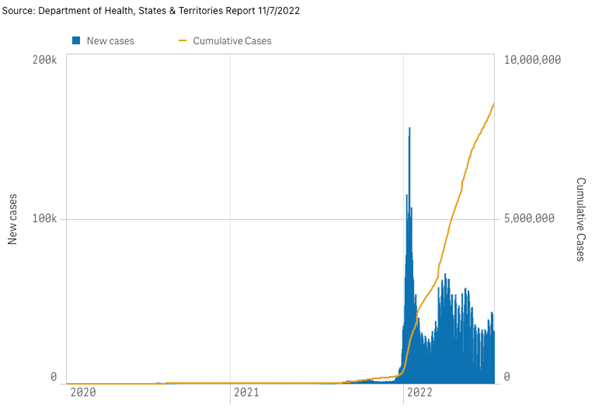
Graph 1: COVID-19 case numbers and statistics
* Source: Department of Health and Ageing, 2022, COVID-19 Case Numbers and Statistics. Accessed on 12 July 2022.
Graph 1 above shows:
- There are a significantly larger number of COVID cases in 2022 compared to 2020/2021.
- The larger number of cases in 2022 means that hospitalisation and number of deaths attributed to COVID are higher than 2020/2021. This is despite COVID now being less likely to cause severe illness and death than it was in 2020/2021.
Teaching note:
Graph 1 shows the total number of new COVID-19 cases in Australia reported by states and territories over time and the cumulative number of confirmed COVID-19 cases reported over time. It is a good illustration of multiple data sets and axis to unpack with your students:
- Blue bar chart line – shows the newly confirmed COVID-19 cases by notification received date.
- Orange line graph – shows the cumulative number of newly confirmed COVID-19 cases by notification received date.
- Horizontal axis – shows the date of notification to state and territory health departments.
- Vertical axis on the left – shows the number of new COVID-19 cases, represented by the bars.
- Vertical axis on the right – shows the cumulative number of COVID-19 cases, represented by the line.
COVID-19 case study: the daily COVID-19 case number updates increased the visibility of epidemiology at work. The high profile of epidemiologists in the media provides a case study opportunity for Core 1 revision in preparation for trials or HSC exams. ACHPER NSW board member Luke Adams has developed a template for a COVID-19 case study.
Causes of death in Australia
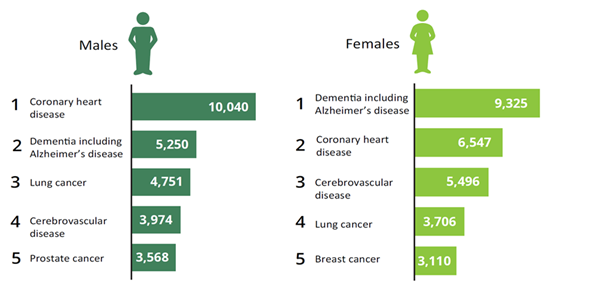
Over the last century, death rates have continuously declined but the leading causes of death have changed:
- Deaths from infectious diseases have decreased
- Deaths from chronic conditions, such as cancers and dementia, have increased.
Graph 2: Cause of death for Australians
Source: AIHW, 2022, Australia’s Health Summary Report. Accessed on 12 July 2022.
Leading cause of death differs by age:
- People aged over 45 years – chronic conditions feature more prominently
- People aged 1-44 years – external causes, such as accidents and suicide are leading causes.
Teaching note:
Direct your students to Chapter 4 of Australia’s Health 2022 to find out more about the leading causes of death.
Trends in life expectancy and mortality
Teaching note: The Stage 6 PDHPE syllabus requires students to use tables and graphs from health reports to analyse current trends. The following could be used for life expectancy, infant mortality and mortality.
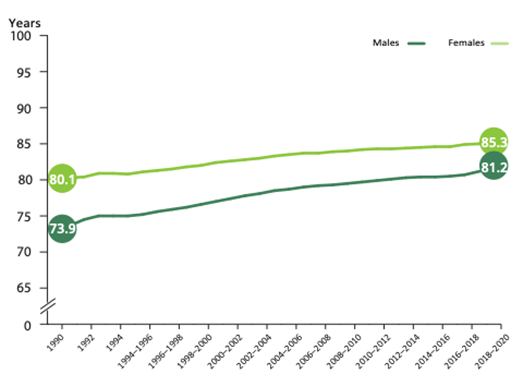
Life expectancy
Life expectancy measures how long, on average, a person is expected to live based on current age and sex-specific death rates.
- Trend: life expectancy at birth in Australia continues to rise for both males and females.
Graph 3: Life expectancy in Australia
Source: AIHW, 2022, Australia’s Health Chapter Summaries. Accessed 12 July 2022.
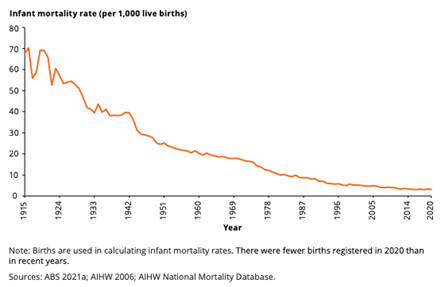
Child and infant mortality
Child and infant mortality measures deaths in live born babies up to 1 year.
- Trend: increases in life expectancy in Australia are largely related to the substantial decrease in child and infant mortality.
Graph 4: Decline in infant mortality rate (per 1,000 live births), 1915-2020
Source: AIHW, 2022, Australia’s Health Chapter Summaries. Accessed 12 July 2022.
Mortality rates
A fundamental aim of epidemiology is to determine whether levels of mortality are rising or falling over time, or whether they differ between population groups. Numbers alone are insufficient to measure differences because they do not account for population size. Mortality rates, on the other hand, are measures that are scaled to the size of the population.
Key trends:
- Cardiovascular diseases were the major cause of death for most years (Graph 5). Exceptions:
- 1919 – the Spanish influenza pandemic caused widespread mortality.
- From 2010 onwards – rates of death from cardiovascular diseases dropped below that from cancers, largely due to improvements in treatment and management.
- Cancer age-standardised rates were generally steady between 1970 and 2000 and have decreased since. This suggests changes in the age at death due to cancer over this period.
Graph 5: Age-Standardised mortality rates (per 100,000 population), by broad cause of death 1907-2020
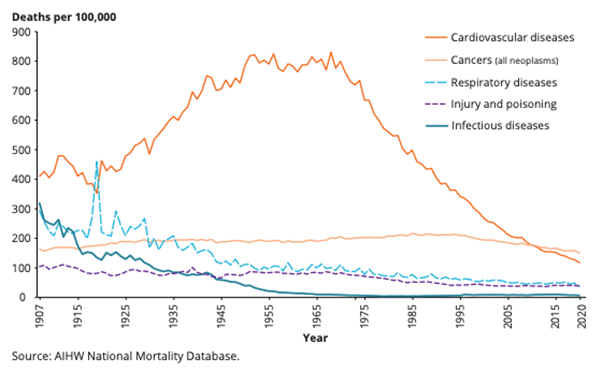
Source: AIHW, 2022, Australia’s Health Chapter Summaries. Accessed 12 July 2022.
More detailed information
Including additional tables and graphs about mortality rates for priority health conditions can be accessed at in the Australia’s Health 2022 – Data insights report